Process Spectroscopy Market Growth CAGR Overview
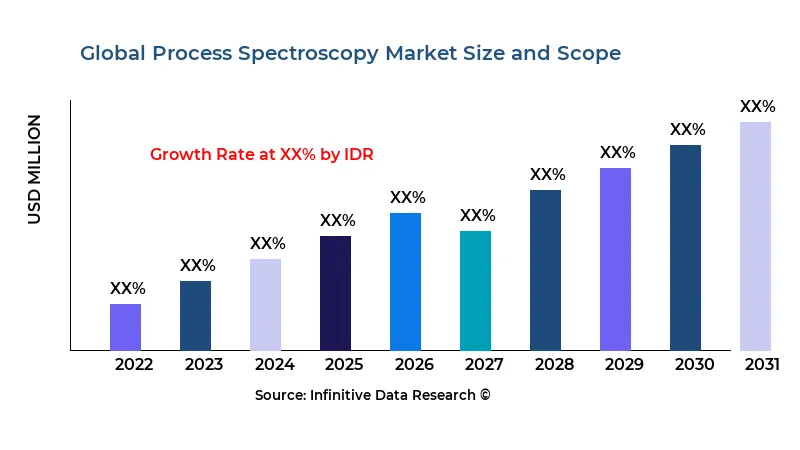
According to research by Infinitive Data Research, the global Process Spectroscopy Market size was valued at USD 21.16 Bln (billion) in 2024 and is Calculated to reach USD 37 Bln (billion) by the end of 2032, growing at an anticipated compound annual growth rate (CAGR) of 8.5% during the forecast period 2024 to 2032. This projected growth is driven by its increasing adoption across Machinery & Equipment industries such as Polymer, Oil & Gas, Pharmaceutical, Food & Agriculture, Chemical, OthersThe process spectroscopy market has witnessed rapid adoption across industries as manufacturers strive for real-time, non-destructive analytical techniques to optimize their operations and ensure product quality. Advances in sensor technology and data analytics have enabled inline and at-line monitoring, reducing batch failures and improving sustainability. Regulatory pressures in pharmaceuticals and food & beverage sectors are driving investments in spectroscopy platforms that can deliver trace-level accuracy and continuous feedback. At the same time, digital transformation initiatives and Industry 4.0 frameworks are increasingly integrating process spectroscopy into smart factory environments, fostering interoperability and remote monitoring.
Continual miniaturization of spectrometers and the rise of portable, handheld devices are opening new applications in field testing and on-site process control. Wireless connectivity and cloud-based data management have further expanded deployment scenarios, allowing organizations to leverage advanced analytics and machine learning for anomaly detection and predictive maintenance. The integration of spectroscopy data with automation platforms enhances decision-making speed and reduces dependency on centralized laboratories. Moreover, growing emphasis on green chemistry and waste reduction is positioning process spectroscopy as a key enabler for sustainable manufacturing practices.
Despite these growth drivers, challenges remain in the form of high initial capital expenditure and the need for skilled personnel to interpret complex spectral data. Variability in sample matrices and the requirement for robust calibration models necessitate ongoing support from equipment vendors and software providers. Standardization of methods across global operations can be difficult, particularly for multinational enterprises operating in regions with differing regulatory frameworks. Nevertheless, strategic partnerships between instrument manufacturers, software developers, and end-users are gradually addressing these pain points through comprehensive service offerings and turnkey solutions.
Looking ahead, the convergence of spectroscopy with emerging technologies such as hyperspectral imaging and terahertz spectroscopy is expected to unlock novel use cases in pharmaceuticals, petrochemicals, and environmental monitoring. Collaborative research initiatives and open-source platforms are accelerating innovation, lowering barriers to entry for smaller players. As industries continue to pursue higher throughput, lower downtime, and greater analytical precision, process spectroscopy is poised to become an indispensable tool in the digital transformation of manufacturing processes.
>>> Understand The Key Trends Shaping This Market:- Download PDF Sample
Process Spectroscopy Market Growth Factors
One of the primary growth factors for process spectroscopy is the intensifying need for quality assurance and regulatory compliance in highly regulated sectors such as pharmaceuticals and food & beverage. Companies are investing in real-time monitoring to detect deviations early, ensuring batch uniformity and minimizing costly recalls. Stringent guidelines from bodies like the FDA and EMA are mandating tighter process controls, prompting wider deployment of spectroscopy systems that can provide continuous feedback and traceability.
Another significant driver is the push for operational efficiency and cost reduction in chemical, petrochemical, and water treatment industries. Inline spectroscopy enables operators to optimize reaction conditions, minimize resource consumption, and reduce waste generation. The resulting improvements in yield and energy efficiency translate into substantial cost savings and lower environmental impact. As sustainability becomes a board-level priority, process spectroscopy offers a tangible means to achieve greener manufacturing goals.
Technological innovations, including the integration of artificial intelligence and machine learning algorithms, are enhancing the analytical capabilities of spectroscopy platforms. Predictive models trained on historical spectral data can identify subtle trends and predict process deviations before they occur. This shift from reactive to proactive control is revolutionizing maintenance schedules and reducing unplanned downtime. Cloud-based collaboration tools are also enabling cross-site data sharing, facilitating best-practice standardization and continuous improvement.
Finally, the democratization of spectroscopy through lower-cost sensors and open-source software is broadening the market reach. Small and medium-sized enterprises, which previously found high-end spectroscopy prohibitively expensive, are now adopting basic NIR and UV-Vis solutions for process monitoring. This trend is fostering a more competitive vendor landscape and accelerating innovation cycles. As barriers to adoption continue to fall, the cumulative effect of these growth factors will sustain the market’s robust expansion.
Market Analysis By Competitors
- ABB Group (Switzerland)
- Bruker Corporation (U.S.)
- Buchi Labortechnik AG (Switzerland)
- Danaher Corporation (U.S.)
- Shimadzu Corporation (Japan)
- Sartorius AG (Germany)
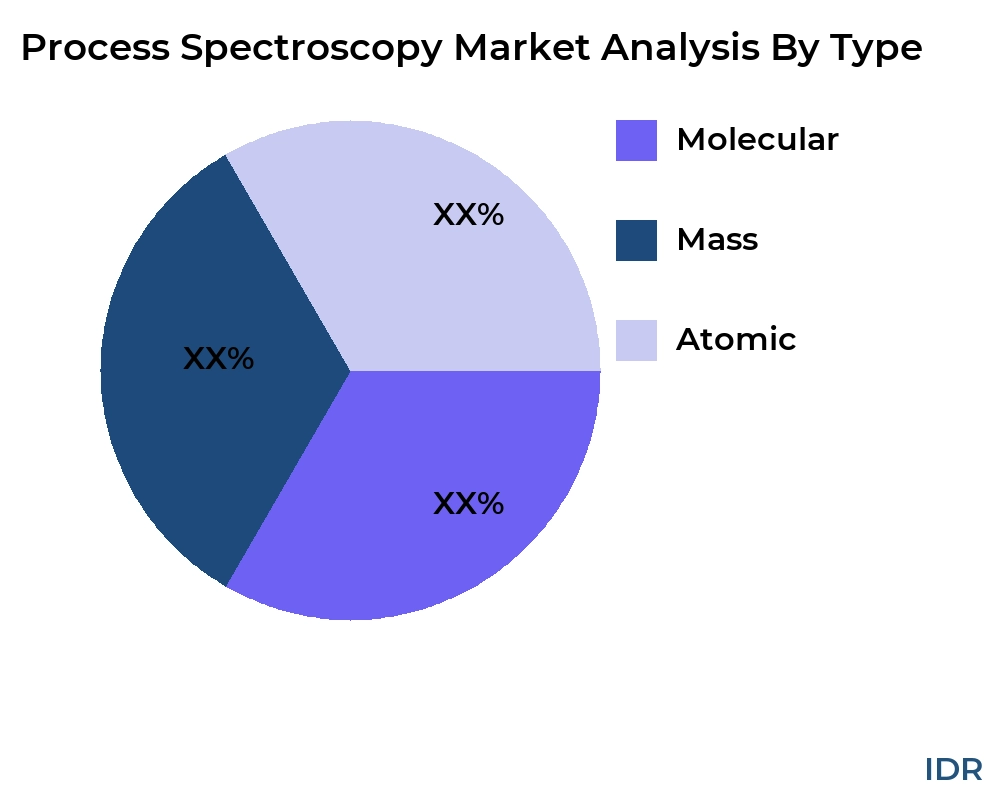
By Product Type
- Molecular
- Mass
- Atomic
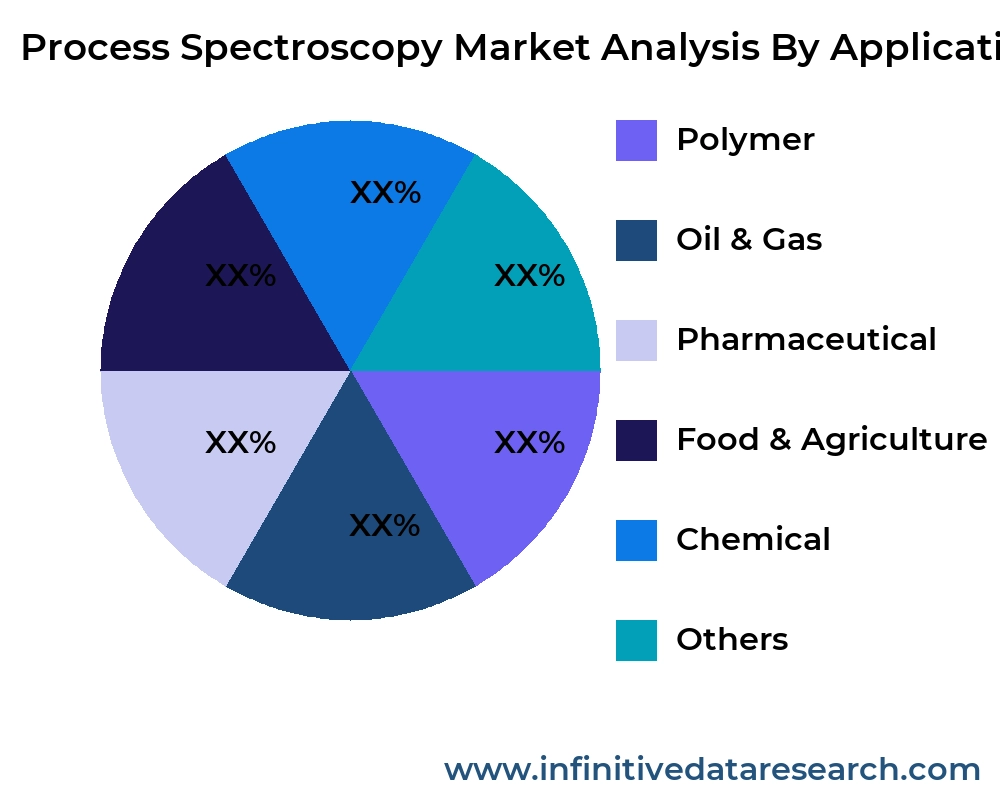
By Application
- Polymer
- Oil & Gas
- Pharmaceutical
- Food & Agriculture
- Chemical
- Others
>>> Understand The Key Trends Shaping This Market:- Understand The Key Trends Shaping This Market:-
Process Spectroscopy Market Segment Analysis
- Distribution Channel
Process spectroscopy systems are sold primarily through direct sales channels for large capital projects, ensuring customized integration and service contracts. Distributors and channel partners play a key role in serving mid-sized enterprises, offering packaged solutions and localized support. Online platforms are emerging for consumables, software updates, and minor instrumentation purchases, streamlining procurement and reducing lead times. OEM partnerships with equipment manufacturers also embed spectroscopy modules directly into processing lines, creating new revenue streams for instrumentation vendors.
- Compatibility
Compatibility with existing process control and enterprise resource planning (ERP) systems is critical for seamless integration. Vendors are developing open-architecture spectrometers that support standard industrial communication protocols such as OPC UA and Modbus. Software interoperability ensures that spectral data can be aggregated with SCADA and LIMS platforms for unified analytics. Customizable APIs and SDKs allow IT teams to build bespoke dashboards and alerts, while multivendor compatibility reduces vendor lock-in and supports mix-and-match configurations.
- Price
The price spectrum for process spectroscopy ranges from entry-level benchtop instruments priced under USD 20,000 to turnkey inline systems exceeding USD 200,000. Total cost of ownership (TCO) considerations include installation, calibration, maintenance, and software licensing fees. Subscription-based models for software analytics are gaining traction, lowering upfront investment and enabling predictable operating expenses. Volume discounts and bundled service agreements further influence purchasing decisions, particularly for global rollouts.
- Product Type
Product offerings span multiple technologies—near-infrared (NIR), Raman, ultraviolet-visible (UV-Vis), and mid-infrared (MIR) spectroscopy—each suited to different molecular analyses and process conditions. NIR dominates in applications requiring moisture and compositional analysis, while Raman excels in high-throughput chemical monitoring. UV-Vis systems are widely used for color and concentration measurements in pharmaceutical and food industries. Emerging technologies such as terahertz and hyperspectral imaging are carving out niche applications in advanced materials and environmental monitoring.
| REPORT ATTRIBUTES | DETAILS |
|---|---|
| Study Period |
2019-2032 |
| Base Year |
2023 |
| Forecast Period |
2024-2032 |
| Historical Period |
2019-2022 |
| Unit |
Value (USD Billion) |
| Key Companies Profiled |
ABB Group (Switzerland), Bruker Corporation (U.S.), Buchi Labortechnik AG (Switzerland), Danaher Corporation (U.S.), Shimadzu Corporation (Japan), Sartorius AG (Germany) |
| Segments Covered |
By Product |
| Customization Scope |
Free report customization (equivalent to up to 3 analyst working days) with purchase. Addition or alteration to country, regional and segment scope |
>>> Overview of Market Analysis:- Download PDF Sample
Process Spectroscopy Market Regional Analysis
North America leads the process spectroscopy market, driven by strong presence of pharmaceutical giants, chemical manufacturers, and oil & gas producers. The United States accounts for the largest share, with regulatory mandates and digitalization strategies in manufacturing underpinning adoption. Canada’s growing petrochemical and mining sectors also contribute to steady demand for inline analytical solutions. Vendors maintain extensive service networks across both countries, delivering rapid installation and calibration services.
Europe holds the second-largest share, propelled by robust industrial bases in Germany, France, and the UK. The region’s emphasis on sustainable manufacturing and strict environmental regulations fosters investments in process monitoring to reduce emissions and waste. Germany’s automotive and chemical industries are particularly active adopters, integrating spectroscopy for paint curing and polymer production control. The European Union’s funding for Industry 4.0 initiatives further accelerates digital transformation in mid-sized enterprises.
Asia-Pacific is the fastest-growing region, with China, India, and South Korea investing heavily in expanding chemical, pharmaceutical, and food processing capacities. Government incentives for manufacturing modernization and quality enhancement are driving adoption of advanced analytical tools. Local vendors in China are also emerging, offering cost-competitive spectroscopy solutions that cater to domestic market needs. India’s pharmaceutical export ambitions are fueling demand for inline PAT (Process Analytical Technology) frameworks.
The Rest of the World, including Latin America, the Middle East, and Africa, exhibits nascent but growing interest in process spectroscopy. Brazil’s agrochemical and food sectors are early adopters, while Middle Eastern petrochemical complexes seek real-time monitoring solutions to optimize feedstock utilization. Africa’s mining operations are gradually deploying handheld spectroscopy for mineral exploration and process control. Regional distributors and integrators play a crucial role in overcoming infrastructure and skills barriers.
global Process Spectroscopy market revenue (usd million) comparison by players 2024-2032
| Company/players | 2021 | 2022 | 2023 | 2024 | ... | (2032) |
|---|---|---|---|---|---|---|
| ABB Group (Switzerland) | XX | XX | XX | XX | XX | XX |
| Bruker Corporation (U.S.) | XX | XX | XX | XX | XX | XX |
| Buchi Labortechnik AG (Switzerland) | XX | XX | XX | XX | XX | XX |
| Danaher Corporation (U.S.) | XX | XX | XX | XX | XX | XX |
| Shimadzu Corporation (Japan) | XX | XX | XX | XX | XX | XX |
| Sartorius AG (Germany) | XX | XX | XX | XX | XX | XX |
| Total | XX | XX | XX | XX | XX | XX |
global Process Spectroscopy market revenue (usd million) comparison by product type 2024-2032
Product Type
2023
2024
...
2032
CAGR%(2024-32)
Molecular
XX
XX
XX
XX
XX
Mass
XX
XX
XX
XX
XX
Atomic
XX
XX
XX
XX
XX
Total
XX
XX
XX
XX
XX
| Product Type | 2023 | 2024 | ... | 2032 | CAGR%(2024-32) |
|---|---|---|---|---|---|
| Molecular | XX | XX | XX | XX | XX |
| Mass | XX | XX | XX | XX | XX |
| Atomic | XX | XX | XX | XX | XX |
| Total | XX | XX | XX | XX | XX |
global Process Spectroscopy market revenue (usd million) comparison by application 2024-2032
Application
2023
2024
...
2032
CAGR%(2024-32)
Polymer
XX
XX
XX
XX
XX
Oil & Gas
XX
XX
XX
XX
XX
Pharmaceutical
XX
XX
XX
XX
XX
Food & Agriculture
XX
XX
XX
XX
XX
Chemical
XX
XX
XX
XX
XX
Others
XX
XX
XX
XX
XX
Total
XX
XX
XX
XX
XX
| Application | 2023 | 2024 | ... | 2032 | CAGR%(2024-32) |
|---|---|---|---|---|---|
| Polymer | XX | XX | XX | XX | XX |
| Oil & Gas | XX | XX | XX | XX | XX |
| Pharmaceutical | XX | XX | XX | XX | XX |
| Food & Agriculture | XX | XX | XX | XX | XX |
| Chemical | XX | XX | XX | XX | XX |
| Others | XX | XX | XX | XX | XX |
| Total | XX | XX | XX | XX | XX |
>>> Market Understand Through Graph And Chart:- Download PDF Sample
Process Spectroscopy Market Competitive Insights
The competitive landscape of the process spectroscopy market is characterized by a mix of global conglomerates and specialized niche players. Large multinationals leverage broad instrumentation portfolios and deep service networks to win large enterprise contracts. They invest heavily in R&D to push the boundaries of detection limits, miniaturization, and data analytics capabilities. Their comprehensive offerings enable end-to-end lifecycle management, from installation to predictive maintenance.
Specialized vendors focus on particular technologies or industries, offering tailored solutions that address unique process requirements. These players often compete on speed of innovation and agility in responding to customer feedback. They form alliances with software providers and system integrators to bundle hardware, analytics, and professional services. This ecosystem approach enhances their value proposition and fosters stickier customer relationships.
Mergers and acquisitions are frequent as companies seek to broaden their technology stacks and geographic reach. Strategic acquisitions of software firms and analytics startups allow instrumentation giants to offer integrated platforms with advanced predictive capabilities. Conversely, niche players gain access to global distribution channels and capital for scaling their operations. This consolidation trend is reshaping the vendor landscape and elevating competition on service differentiation and total cost of ownership.
Pricing strategies are evolving from perpetual licensing to subscription and “as-a-service” models. This shift lowers barriers to entry for smaller end-users and generates recurring revenue streams for vendors. Bundled service agreements that include calibration, software updates, and training are increasingly common. Vendors differentiate themselves by offering flexible financing and value-added consulting services, moving beyond pure instrumentation sales.
Customer loyalty is heavily influenced by after-sales support and the availability of expert application specialists. Vendors that can provide rapid on-site calibration, 24/7 technical support, and robust training programs enjoy higher retention rates. Online portals with self-service resources and predictive maintenance alerts further enhance the customer experience. In this environment, service excellence is as important as technological prowess in securing long-term partnerships.
Process Spectroscopy Market Competitors
United States
• Thermo Fisher Scientific
• Agilent Technologies
• Emerson Electric Co.
• Honeywell International Inc.
• Endress+Hauser AG
Germany
• Bruker Corporation
• Metrohm AG
• Sartorius AG
• Carl Zeiss AG
• PerkinElmer Inc.
Japan
• Shimadzu Corporation
• JASCO Corporation
• Horiba Ltd.
• Hitachi High-Tech Corporation
• Rigaku Corporation
United Kingdom
• Malvern Panalytical Ltd.
• Renishaw plc
• Ocean Insight Ltd.
• Spectris plc
• Mettler-Toledo International Inc.
China
• Beijing Analytik-Jena Instrument Ltd.
• Shanghai Spectrum Instruments Co., Ltd.
• Beijing Hanon Instruments Co., Ltd.
• Nanjing Jiangnan Analytical Instruments Co.
• Sinomeasure Co., Ltd.
France
• FOSS Analytical France
• Thermo Fisher Scientific (France)
• Horiba Scientific (France)
• Biophysics Instruments SAS
• Analytik Jena France
Process Spectroscopy Market Top Competitors
Thermo Fisher Scientific is a global leader in process spectroscopy instrumentation.
It maintains the broadest product portfolio covering NIR, Raman, and UV-Vis systems.
The company invests over USD 1 billion annually in R&D to enhance detection limits and miniaturize devices.
Its global service network spans over 50 countries, ensuring rapid calibration and technical support.
Thermo Fisher’s strategic partnerships with pharmaceutical and chemical giants bolster its market share.
It continues to drive innovation in cloud-based analytics and IoT-enabled spectroscopy solutions.
Agilent Technologies holds a prominent position in analytical instrumentation with strong roots in chromatography and mass spectrometry.
It has leveraged its legacy to expand into process spectroscopy, particularly in the pharmaceutical sector.
Agilent’s modular spectroscopy platforms offer high throughput and seamless integration with existing LC/MS workflows.
The company’s service excellence is underscored by comprehensive application support and global training programs.
Agilent’s software suite provides advanced chemometric tools for real-time process monitoring and quality control.
Through targeted acquisitions, it has strengthened its mid-infrared and Raman spectroscopy capabilities.
Bruker Corporation is recognized for its high-precision Raman and FT-IR spectroscopy systems.
It serves specialized markets such as polymers, life sciences, and petrochemicals where high resolution is critical.
Bruker’s emphasis on research collaboration has led to breakthroughs in hyperspectral imaging and 2D correlation spectroscopy.
The company operates multiple application laboratories worldwide, providing custom method development services.
Bruker’s product roadmap includes portable Raman units for field use and benchtop systems for QC laboratories.
Its strong academic partnerships enhance its reputation and foster continuous innovation.
Shimadzu Corporation, a pioneer in analytical technologies, has a significant presence in Asia-Pacific.
Its spectroscopy division offers compact, robust NIR and UV-Vis instruments tailored to harsh industrial environments.
Shimadzu invests heavily in local manufacturing facilities and training centers across emerging markets.
Its collaboration with Japanese automakers and petrochemical companies drives adoption in high-precision applications.
The company’s integrated software platforms streamline data management and regulatory compliance.
Shimadzu continues to expand its footprint through strategic alliances with system integrators and software vendors.
PerkinElmer, known for its life-science and environmental solutions, has made inroads into process spectroscopy.
Its NIR spectroscopy systems are widely used in food & beverage quality control and agricultural testing.
PerkinElmer’s service network offers rapid on-site calibration and preventive maintenance packages.
The company emphasizes user-friendly interfaces and turnkey installation services for small to mid-sized enterprises.
Collaborations with research institutions enable it to tailor spectroscopy solutions for novel applications.
PerkinElmer’s global supply chain ensures timely delivery of consumables and spare parts.
Emerson Electric Co. brings its expertise in automation and control systems to the spectroscopy market.
Emerson’s spectroscopy solutions are deeply integrated with its DeltaV and Ovation process control platforms.
This enables seamless data flow from spectrometers to DCS systems for closed-loop process optimization.
The company’s strong presence in oil & gas and power generation industries underpins its spectroscopy sales.
Emerson offers comprehensive training and support services, leveraging its global automation network.
It continues to develop ruggedized, explosion-proof spectrometers for hazardous environments.
Endress+Hauser AG is a leading instrumentation specialist in process automation.
It offers a range of inline NIR and UV-Vis spectroscopy probes designed for hygienic and industrial processes.
Endress+Hauser’s extensive field instrumentation portfolio complements its spectroscopy offerings.
The company emphasizes seamless interoperability with fieldbus and Industrial Ethernet protocols.
Its global sales and service network ensures quick commissioning and local support.
Endress+Hauser invests in digital services that provide predictive maintenance and remote diagnostics.
Honeywell International Inc. leverages its automation heritage to deliver spectroscopy solutions integrated with Experion DCS.
Honeywell’s smart sensors and edge computing platforms enable real-time spectral analysis at the plant floor.
The company’s focus on IIoT and cybersecurity enhances the safety and reliability of its spectroscopy systems.
Honeywell offers subscription-based software analytics, lowering entry barriers for small and mid-sized users.
Strategic alliances with chemical and pharmaceutical leaders drive co-development of application-specific solutions.
Honeywell continues to expand its global support infrastructure with emphasis on remote monitoring services.
ABB Ltd. has entered the process spectroscopy arena through organic development and strategic acquisitions.
ABB’s spectroscopy systems are designed for heavy industry, including mining and steel production.
The company integrates spectroscopy data with its Ability™ digital platform for cross-asset analytics.
ABB’s strong presence in electrical and automation equipment facilitates bundled solution offerings.
It emphasizes energy efficiency and predictive maintenance benefits of real-time analytical data.
ABB continues to explore advanced spectroscopy techniques, including terahertz and laser-based methods.
Metrohm AG, a Swiss specialist in titration and spectroscopy, is renowned for its precision instruments.
Metrohm’s Raman and NIR spectrometers are favored in academic and highly regulated laboratory settings.
The company invests heavily in chemometrics software to simplify spectral data interpretation.
Metrohm’s global dealer network provides localized sales, training, and support services.
The company’s modular product design allows customers to scale systems as needs evolve.
Metrohm continues to expand its application library, covering food safety, environmental monitoring, and pharmaceuticals.
The report provides a detailed analysis of the Process Spectroscopy market across various regions, highlighting the unique market dynamics and growth opportunities in each region.
- US
- Canada
- Mexico
- UK
- Germany
- France
- Italy
- Russia
- Spain
- Switzerland
- Austria
- Belgium
- Rest of Europe
- China
- Japan
- South Korea
- Indonesia
- Vietnam
- Philippines
- Australia
- Thailand
- Singapore
- Rest of APAC
- UAE
- Saudi Arabia
- Egypt
- South Africa
- Israel
- Rest of MEA
- Brazil
- Argentina
- Rest of Latin America
>>> Need A Different Region Or Segment? Download PDF Sample
Key Takeaways
- The global Process Spectroscopy market is expected to grow significantly from 2024 to 2032, driven by technological advancements, increasing demand, and government investments in urbanization.
- The market is characterized by a diverse range of manufacturers, product types, and applications, catering to different consumer needs and preferences.
- Regional insights highlight the unique market dynamics and growth opportunities in various regions, including North America, Europe, Asia-Pacific, Latin America, and the Middle East & Africa.
- The competitive landscape features key players who have created a dynamic and diverse market environment through collaborations, mergers and acquisitions, and innovative product developments.
- Market trends such as technological advancements, sustainability, customization, and digital transformation are shaping the growth and development of the Process Spectroscopy market.
- Despite the positive outlook, the market faces challenges such as regulatory compliance, high initial investment costs, and economic uncertainties.
- The report provides comprehensive coverage of market size, market share, growth factors, and strategic insights to help businesses navigate the dynamic Process Spectroscopy market and achieve long-term success.
By leveraging the information provided in this report, businesses can develop effective strategies, address market challenges, and capitalize on growth opportunities to ensure sustainable growth and long-term success in the global Process Spectroscopy market.
- Introduction
- Objectives of the Study
- Market Definition
- Research Scope
- Currency
- Key Target Audience
- Research Methodology and Assumptions
- Executive Summary
- Premium Insights
- Porter’s Five Forces Analysis
- Value Chain Analysis
- Top Investment Pockets
- Industry Trends
- Market Dynamics
- Market Evaluation
- Drivers
- Restraints
- Opportunities
- Challenges
- Global Process Spectroscopy Market Analysis and Projection, By Companies
- Segment Overview
- ABB Group (Switzerland)
- Bruker Corporation (U.S.)
- Buchi Labortechnik AG (Switzerland)
- Danaher Corporation (U.S.)
- Shimadzu Corporation (Japan)
- Sartorius AG (Germany)
- Global Process Spectroscopy Market Analysis and Projection, By Type
- Segment Overview
- Molecular
- Mass
- Atomic
- Global Process Spectroscopy Market Analysis and Projection, By Application
- Segment Overview
- Polymer
- Oil & Gas
- Pharmaceutical
- Food & Agriculture
- Chemical
- Others
- Global Process Spectroscopy Market Analysis and Projection, By Regional Analysis
- North America
- US
- Canada
- Mexico
- Europe
- UK
- Germany
- France
- Italy
- Russia
- Spain
- Switzerland
- Austria
- Belgium
- Rest of Europe
- Asia Pacific
- China
- Japan
- South Korea
- Indonesia
- Vietnam
- Philippines
- Australia
- Thailand
- Singapore
- Rest of APAC
- Middle East
- UAE
- Saudi Arabia
- Egypt
- South Africa
- Israel
- Rest of MEA
- Latin America
- Brazil
- Argentina
- Rest of Latin America
- Global Process Spectroscopy Market-Competitive Landscape
- Overview
- Market Share of Key Players in the Process Spectroscopy Market
- Global Company Market Share
- North America Company Market Share
- Europe Company Market Share
- APAC Company Market Share
- Competitive Situations and Trends
- Coverage Launches and Developments
- Partnerships, Collaborations, and Agreements
- Mergers & Acquisitions
- Expansions
- Company Profiles
- ABB Group (Switzerland)
- Business Overview
- Company Snapshot
- Company Market Share Analysis
- Company Coverage Portfolio
- Recent Developments
- SWOT Analysis
- Bruker Corporation (U.S.)
- Business Overview
- Company Snapshot
- Company Market Share Analysis
- Company Coverage Portfolio
- Recent Developments
- SWOT Analysis
- Buchi Labortechnik AG (Switzerland)
- Business Overview
- Company Snapshot
- Company Market Share Analysis
- Company Coverage Portfolio
- Recent Developments
- SWOT Analysis
- Danaher Corporation (U.S.)
- Business Overview
- Company Snapshot
- Company Market Share Analysis
- Company Coverage Portfolio
- Recent Developments
- SWOT Analysis
- Shimadzu Corporation (Japan)
- Business Overview
- Company Snapshot
- Company Market Share Analysis
- Company Coverage Portfolio
- Recent Developments
- SWOT Analysis
- Sartorius AG (Germany)
- Business Overview
- Company Snapshot
- Company Market Share Analysis
- Company Coverage Portfolio
- Recent Developments
- SWOT Analysis
List of Table
- Drivers of Global Process Spectroscopy Market: Impact Analysis
- Restraints of Global Process Spectroscopy Market: Impact Analysis
- Global Process Spectroscopy Market, By Technology, 2023-2032(USD Billion)
- global Molecular, Process Spectroscopy Market, By Region, 2023-2032(USD Billion)
- global Mass, Process Spectroscopy Market, By Region, 2023-2032(USD Billion)
- global Atomic, Process Spectroscopy Market, By Region, 2023-2032(USD Billion)
- global Polymer, Process Spectroscopy Market, By Region, 2023-2032(USD Billion)
- global Oil & Gas, Process Spectroscopy Market, By Region, 2023-2032(USD Billion)
- global Pharmaceutical, Process Spectroscopy Market, By Region, 2023-2032(USD Billion)
- global Food & Agriculture, Process Spectroscopy Market, By Region, 2023-2032(USD Billion)
- global Chemical, Process Spectroscopy Market, By Region, 2023-2032(USD Billion)
- global Others, Process Spectroscopy Market, By Region, 2023-2032(USD Billion)
List of Figures
- Global Process Spectroscopy Market Segmentation
- Process Spectroscopy Market: Research Methodology
- Market Size Estimation Methodology: Bottom-Up Approach
- Market Size Estimation Methodology: Top-down Approach
- Data Triangulation
- Porter’s Five Forces Analysis
- Value Chain Analysis
- Top investment pocket in the Process Spectroscopy Market
- Top Winning Strategies, 2023-2032
- Top Winning Strategies, By Development, 2023-2032(%)
- Top Winning Strategies, By Company, 2023-2032
- Moderate Bargaining power of Buyers
- Moderate Bargaining power of Suppliers
- Moderate Bargaining power of New Entrants
- Low threat of Substitution
- High Competitive Rivalry
- Restraint and Drivers: Process Spectroscopy Market
- Process Spectroscopy Market Segmentation, By Technology
- Process Spectroscopy Market For Live Attenuated, By Region, 2023-2033 ($ Billion)
- Global Process Spectroscopy Market, By Technology, 2023-2032(USD Billion)
- global Molecular, Process Spectroscopy Market, By Region, 2023-2032(USD Billion)
- global Mass, Process Spectroscopy Market, By Region, 2023-2032(USD Billion)
- global Atomic, Process Spectroscopy Market, By Region, 2023-2032(USD Billion)
- global Polymer, Process Spectroscopy Market, By Region, 2023-2032(USD Billion)
- global Oil & Gas, Process Spectroscopy Market, By Region, 2023-2032(USD Billion)
- global Pharmaceutical, Process Spectroscopy Market, By Region, 2023-2032(USD Billion)
- global Food & Agriculture, Process Spectroscopy Market, By Region, 2023-2032(USD Billion)
- global Chemical, Process Spectroscopy Market, By Region, 2023-2032(USD Billion)
- global Others, Process Spectroscopy Market, By Region, 2023-2032(USD Billion)
- ABB Group (Switzerland): Net Sales, 2023-2033 ($ Billion)
- ABB Group (Switzerland): Revenue Share, By Segment, 2023 (%)
- ABB Group (Switzerland): Revenue Share, By Region, 2023 (%)
- Bruker Corporation (U.S.): Net Sales, 2023-2033 ($ Billion)
- Bruker Corporation (U.S.): Revenue Share, By Segment, 2023 (%)
- Bruker Corporation (U.S.): Revenue Share, By Region, 2023 (%)
- Buchi Labortechnik AG (Switzerland): Net Sales, 2023-2033 ($ Billion)
- Buchi Labortechnik AG (Switzerland): Revenue Share, By Segment, 2023 (%)
- Buchi Labortechnik AG (Switzerland): Revenue Share, By Region, 2023 (%)
- Danaher Corporation (U.S.): Net Sales, 2023-2033 ($ Billion)
- Danaher Corporation (U.S.): Revenue Share, By Segment, 2023 (%)
- Danaher Corporation (U.S.): Revenue Share, By Region, 2023 (%)
- Shimadzu Corporation (Japan): Net Sales, 2023-2033 ($ Billion)
- Shimadzu Corporation (Japan): Revenue Share, By Segment, 2023 (%)
- Shimadzu Corporation (Japan): Revenue Share, By Region, 2023 (%)
- Sartorius AG (Germany): Net Sales, 2023-2033 ($ Billion)
- Sartorius AG (Germany): Revenue Share, By Segment, 2023 (%)
- Sartorius AG (Germany): Revenue Share, By Region, 2023 (%)
Infinitive Data Research provides comprehensive market research, offering in-depth market analysis to help companies understand their target market and industry competition. This research predicts the market acceptance of your brand and products, ensuring informed decision-making for business success.
Competitor Analysis in the Process Spectroscopy Industry
Conducting a competitor analysis involves identifying competitors within the Process Spectroscopy industry and studying their various marketing strategies. This comparative data allows you to assess your company's strengths and weaknesses relative to competitors, providing insights to enhance your market position.
Importance of Continuous Market Research
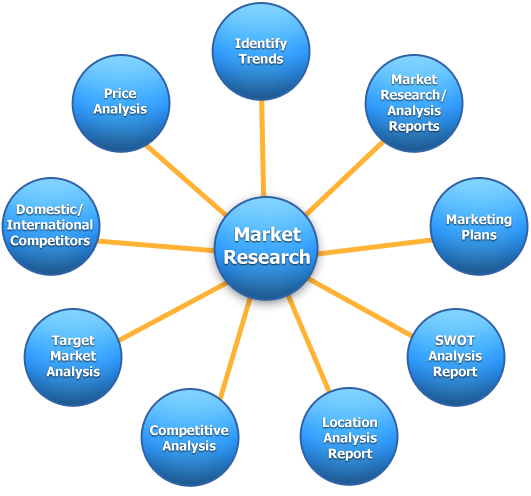
Consistently conducting market research is essential for minimizing risk at every stage of business operations. Process Spectroscopy market research enables you to collect qualitative and quantitative data, which, when properly analyzed, leads to wise decisions that align with user and customer needs. Below are some crucial lessons learned through the Process Spectroscopy market research process:
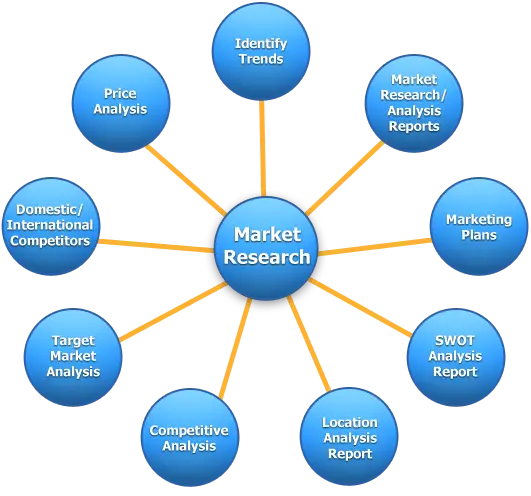
Key Dimensions of Process Spectroscopy Market Analysis
- Trend and Pattern Identification: Analyzing data to spot market trends and patterns.
- Pricing Analysis: Assessing keyword pricing strategies.
- Actionable Insights: Implementing insights derived from data analysis.
- Market Potential: Evaluating the potential of the Process Spectroscopy market.
- Competitor Analysis: Studying competitors' strategies and performance.
- Location Analysis: Assessing optimal locations for market penetration.
- Distribution Channels Analysis: Evaluating the effectiveness of distribution channels.
- Market Size and Growth Rate: Measuring market size and growth potential.
- Market Profitability: Assessing profitability prospects.
- Key Success Factors: Identifying critical factors for success.
- Cost Structure: Understanding the cost structure within the Process Spectroscopy industry.
Target Audience for the Report
This report is valuable for a diverse audience, including:
- Process Spectroscopy Market Manufacturers: To understand market dynamics and enhance production strategies.
- Investors and Financing Companies: To assess investment opportunities and risks.
- Process Spectroscopy Market Suppliers: To identify market demands and supply chain efficiencies.
Necessity of the Report
Making Crucial Business Decisions
Understanding the Process Spectroscopy market, competition, and industry landscape is vital for making informed business decisions. Without current and relevant market research, decisions may be based on outdated or irrelevant information, potentially harming the business.
Securing Investment Funds
Attracting investors requires demonstrating thorough market research. Investors need assurance that you understand the sector, current and potential competition, and whether your idea addresses a market need.
Identifying New Business Opportunities
Process Spectroscopy market research goes beyond understanding trends and consumer behavior. It identifies new revenue streams and opportunities for business pivots. These insights can lead to strategic changes in the business model, promoting growth and adapting to market challenges.
Avoiding Business Failures
Market research also plays a crucial role in risk mitigation. It can reveal when not to pursue certain actions, saving the company from potential losses in revenue, brand image, and more. This proactive approach is often overlooked but is essential for long-term success.
Conclusion
Infinitive Data Research's comprehensive Process Spectroscopy market research provides critical insights for making solid business decisions, securing investments, identifying new opportunities, and avoiding potential failures. Understanding market dynamics through continuous research ensures your company remains competitive and thrives in the Process Spectroscopy industry.

